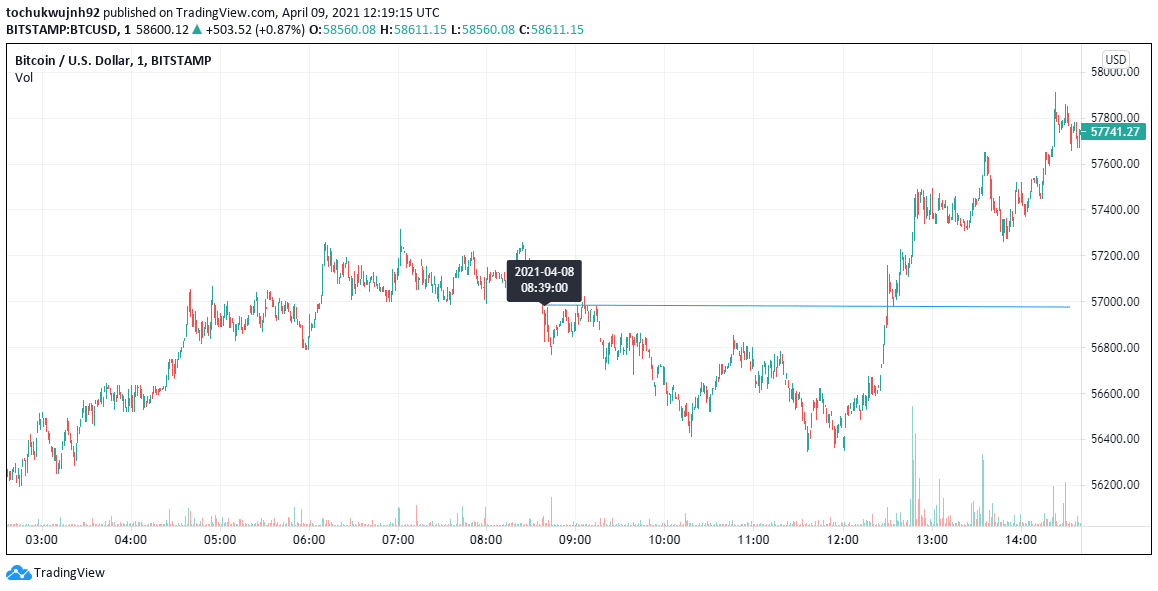
The digital currency giant started the month with another attempt to breach the $60,000 benchmark level. Unfortunately, it was unable to overcome this resistance through the week as it set a range between $60,000 and $57,000. Despite Bitcoin moved sideways over the last week of trading as it sits at $58,600, experts echo the likelihood of a short-term bullish continuation.
Barely recovering it’s loses on Thursday, fresh doubt about the possibility of the bull run continuing this month is emerging amongst traders and analysts alike.
Bitcoin Price Growth Will Happen But Not Now?
After taking a sharp fall of 4% on Wednesday dropping to as low as $55,600, Bitcoin was seen to have break beneath the resistance range of $60,000 and $57,000.
Cantering Clark, a popular twitter trader and market mercenary believes that the dip is even more reason why April to May puts a lid on Bitcoin growth until later in the year using a 20-week moving average as yardstick.

By loading the tweet, you agree to Twitter’s privacy policy.
Learn more
Bitcoin established a support at $57,000 on Wednesday. Even though this support was penetrated as BTC plummeted as low as $55,440, the buyers regrouped at this low and managed to allow BTC to rebound above $58,000 on Thursday. Today, BTC continued higher to break resistance at $58,355 to reach as high as $58,600.
What the Technicals are Saying
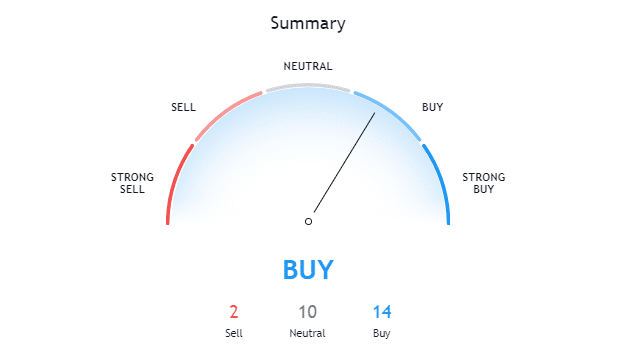
A look at the technical shows that it still supports a “buy” trend. According to TradingView’s technical analysis, 14 of the 26 technical indicators are signaling “buy” while only 10 remains neutral, while 2 of the technical indicators signal “sell”.
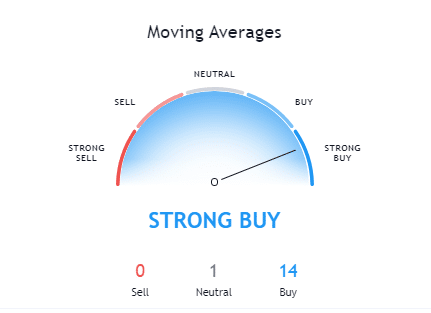
Trading view’s moving averages supports a “strong buy” action. With technicals signaling buy, more trading action is expected to happen in the coming days.
Market Outlook
Overall, the crypto bull market is still intact. However, BTC is ranging, did not break out yet above $58k, which it needs to develop momentum to the upside and to reach new all time highs around $68k. The question is, when this will happen?
By loading the tweet, you agree to Twitter’s privacy policy.
Learn more
Intermediate dips of BTC can be considered buying opportunities in case one believes in a bullish continuation, which we do. ETH looks a bit stronger than BTC at the moment, hovering below $2100. Next big move of ETH and ALTs is anticipated in next months. Major improvements of ETH like for better scaling are expected to be deployed until July. That should push ETH’s price to new heights and also help other altcoins.
So when ETH has its big move, other altcoins will follow. In the meantime BNB has taken the lead for now, steadily climbing to $425 now, and $500 seems inevitable. While ETH is waiting for scaling and cost reduction, the Binance Smart Chain already offers fast and cheap transactions. In case Bitcoin’s dominance drops further to around 52%, this might be considered a break point for altcoins’ up move. Bitcoin is expected to take the lead again at this point.
Want to receive live updates on our premium crypto market sentiment and high quality investment signals of when to buy and sell crypto asset to not miss out the next bull run? Signup today
